Creating a Checker Pattern by Incorrectly Using FFT
or Wavy Gravy
18 Dec 2019 - atrodo - Song: Wavy Gravy by Mayfair Laundry
After writing the previous two posts, I wanted to take a moment to share an experience I had in hopes that if someone else experiences it as well, this can help them. I had replicated Cooley-Tukey in code and was getting what I knew were accurate results because FFTW was producing the save results.
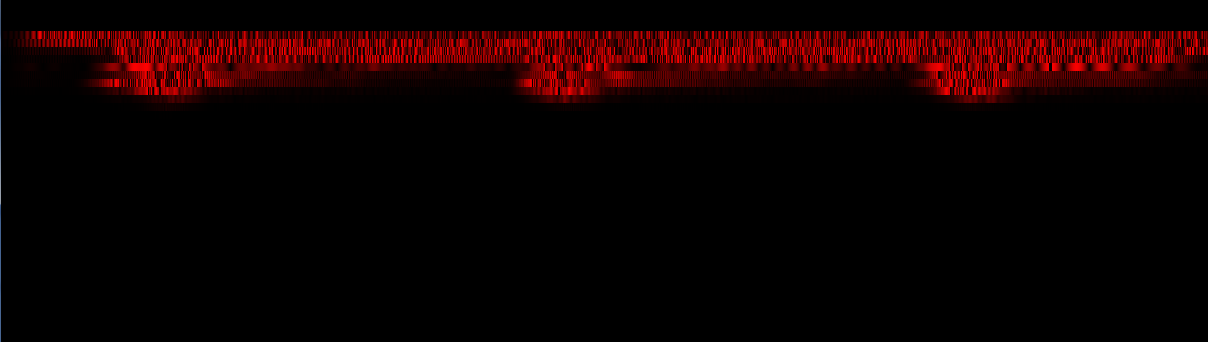
However, once I took the output and created a spectrogram, the picture was not I what I was expecting. It had wavy, or oscillating, strengths of sound. I tried to press forward, but the odd look of those graphs bothered me and it didn’t look right. So much so, that I kept searching the internet for answers but could not find any anything. Plus, the output was the same as FFTW, so the function couldn’t be that wrong, right?
But while I was working though some other things, I came across a minor comment in this stackoverflow answer that made all of it click into place. Somehow I had gotten in my mind that the real part of the imaginary number was the amplitude of the original frequency and the imaginary part was the phase. I’m not sure why I had thought that was the case, but it is very much not the case.
The phase is the angle of the imaginary number and the amplitude is the length.
Once I adjusted my FFT function to return sqrt(real ** 2 + imag ** 2),
the spectrogram looked exactly as I was expecting a spectrogram to look.
I should have seen noticed this when I swapped the output of my FFT function to return the imaginary part and received a nearly identical looking image.